Discover how the design thinking Venn diagram merges creativity and problem-solving. It connects different aspects for innovative solutions. Venn diagrams visually show relationships, aiding in decision-making and analysis. This tool is key in the design thinking process, offering a structured way to explore options and solutions. By understanding the intersections of ideas, you can propel your innovation forward. Explore this method further to enhance your problem-solving skills and gain fresh insights into the design thinking process.
Key Takeaways
- Venn diagrams aid in design thinking by visually connecting data to the central challenge.
- They compare and contrast ideas, identifying key concepts efficiently.
- Venn diagrams help in problem definition and analyzing various perspectives.
- Useful during the empathize phase, they foster a structured approach to innovation.
- Encourage a holistic view, facilitating efficient connection establishment in the design process.
History of Venn Diagram
The history of the Venn diagram dates back to the late 19th century when it was first mentioned in the Philosophical Magazine. Originally introduced in 1880, this visualization tool has its design thinking rooted in the need to represent relationships between different sets of items.
Although its concept can be traced back at least 600 years, similar diagrams were utilized by Ramon Llull and Gottfried Wilhelm von Leibnitz before John Venn's formalization. The Venn diagram shares similarities with Euler diagrams, which were crafted by Leonhard Euler in the 18th century.
This diagram proves instrumental in reasoning through logic, showcasing various operations, and studying commonalities and differences among languages. Its utility extends to aiding in decision-making processes, predicting probabilities, and facilitating clearer comparisons between different elements.
When to Use a Venn Diagram
You should use a Venn diagram when you need to visually represent decision-making processes, compare different options, and predict outcomes based on logic and relationships.
By utilizing a Venn diagram, you can efficiently analyze commonalities and differences among various design solutions, aiding in problem-solving and data interpretation.
This visualization tool is particularly valuable in the defining phase of design thinking, helping you organize ideas and understand connections effectively.
Decision-Making Visualization
Consider using a Venn diagram when comparing and contrasting different ideas for decision-making visualization. Venn diagrams are an excellent tool in the design process to help organize information effectively and identify connections between different elements. Below is a table showcasing when using a Venn diagram can be particularly advantageous in decision-making visualization:
| Scenario | Benefits |
|---|---|
| Comparing multiple design concepts | Enables a clear comparison of strengths and weaknesses of each concept |
| Analyzing potential solutions | Helps in identifying overlapping areas where solutions can be combined for a thorough approach |
| Evaluating project requirements | Facilitates understanding of essential components and where they intersect for best planning |
Comparing and Predicting
When comparing and predicting relationships between different sets of items or choices, utilizing a Venn diagram can provide a structured visual representation. Venn diagrams are particularly useful when you need to compare two distinct sets or categories, where the overlapping circles showcase the commonalities and differences between them.
In the field of design methods, Venn diagrams offer a clear and concise way to analyze relationships and make predictions based on the intersections and exclusions within the circles.
Logic and Relationships
The utilization of Venn diagrams is beneficial for illustrating logical relationships between sets of items or choices. When you need to analyze how different sets of data intersect or relate to each other, a Venn diagram can simplify the process. The diagram shows the relationships between sets by visually representing the overlapping areas, making it easier to understand the connections between various elements.
Here is a table that demonstrates the use of a Venn diagram to showcase logical relationships:
| Logical Relationship | Example 1 | Example 2 |
|---|---|---|
| Intersecting Sets | A, B | C, D |
| Disjoint Sets | E | F, G |
| Subset Relationship | H (subset of I) | J, K (subset of L) |
Types of Venn Diagram
Common types of Venn diagrams include the Scaled Venn Diagram, Randolph diagram (R-diagram), and Euler Diagram. Venn diagrams can utilize two, three, four, or five circles to represent different sets of data. Each circle in a Venn diagram contains unique information, while overlapping areas display commonalities between the sets.
Particularly useful for visualizing similarities and differences between concepts or data sets, Venn diagrams are essential tools in various fields. When using a Venn diagram, you can easily identify relationships and patterns that mightn't be as apparent when looking at raw data.
In design processes, Venn diagrams aid in organizing data, identifying patterns, and connecting information to the main issue being addressed. By visually representing the relationships between different components, a Venn diagram can help you analyze complex problems and develop creative solutions.
Whether you're trying to understand customer preferences, segment data, or brainstorm ideas, these types of Venn diagrams can be invaluable tools in your problem-solving arsenal.
When Not to Use a Venn Diagram
When you have an excess of categories, a Venn diagram mightn't be the best option as it can lead to confusion and lack of clarity.
Similarly, if your distinctions between categories aren't clear, choosing a Venn diagram could potentially muddle the information rather than clarify it.
In situations where you're dealing with complex or abstract data that requires precise representation, you might want to explore alternative visualization methods instead of a Venn diagram.
Overabundance of Categories
Using a Venn diagram becomes challenging when you have an excess of categories to represent, leading to clutter and reduced clarity.
When faced with numerous classes of objects, the comprehensibility of the diagram diminishes.
The effectiveness of a Venn diagram is compromised when the number of categories exceeds a manageable limit, making it convoluted and difficult to interpret.
Representing a large number of diverse elements within a Venn diagram can result in a lack of clear distinctions and hinder the conveyance of complex relationships.
In such cases, it's advisable to explore alternative visualization methods that can better illustrate the intricate connections between the various categories.
Lack of Clear Distinctions
A Venn diagram should be avoided when trying to represent a large number of elements with intricate relationships. Venn diagrams aren't ideal for situations where there's a lack of clear distinctions between elements or when the relationships between sets become complex.
When dealing with a vast number of elements, using a Venn diagram may lead to confusion rather than providing clarity. It's important to recognize that clear comprehension can be compromised when trying to depict intricate data using this type of diagram.
Venn diagrams are most effective when showcasing simple and easily visualized relationships between sets. Hence, when faced with intricate data or numerous elements that lack clear boundaries, it's advisable to explore alternative visualization methods that can better convey the complexity and relationships present in the data.
Complex or Abstract Data
For data that's complex or abstract and doesn't neatly fit into set categories, utilizing a Venn diagram may not be the most effective visualization method.
When dealing with intricate relationships that can't be easily segmented into distinct sets, Venn diagrams may not offer a clear representation.
Here are some reasons why Venn diagrams mightn't be suitable for complex or abstract data:
- Venn diagrams may lead to clutter and confusion, especially when representing many classes of objects.
- If the data requires clear comprehension without overlapping sets, a Venn diagram mightn't be the best choice.
- For complex or abstract data that may not fit neatly into set categories, Venn diagrams can be challenging to utilize effectively.
Services & Expertise

Drawing on its specialization in UI UX Design, User & Design Research, Data Design, and Service Design, the company offers a diverse range of expertise to support innovation and design projects. By leveraging these core areas, the company provides valuable insights and solutions that are grounded in recent industry trends and developments. Through its strategic approach, the company utilizes a cross-functional methodology to drive meaningful outcomes in the innovation process.
In addition to its specialized services, the company also shares its wealth of knowledge and resources through various social media platforms like Twitter. This enables a broader audience to benefit from the company's expertise and stay informed about the latest trends in design and innovation.
Importance of Cross-Functional Thinking
With its focus on specialized services and expertise, the company underscores the importance of cross-functional thinking in achieving true innovation.
Cross-functional thinking is pivotal as it combines desirability, feasibility, and viability, ensuring that innovations meet customer needs, are technically feasible, and economically viable.
This holistic approach to innovation guarantees that products not only appeal to consumers but can also be successfully developed and sustained in the market.
- Desirability: Ensuring that the innovation meets the needs and desires of the target audience.
- Feasibility: Confirming that the innovation is technically possible to create and implement.
- Viability: Guaranteeing that the innovation is economically sustainable and profitable.
Components of True Innovation
What're the fundamental components that constitute genuine innovation?
Genuine innovation comprises desirability, feasibility, and viability. Desirability guarantees that the product or solution meets the needs and desires of the customers or end-users. Feasibility focuses on the technical aspects, such as whether the idea can be realistically implemented with the available resources and technology. Viability considers the economic sustainability, ensuring that the innovation can generate value for the organization and is financially feasible in the long run.
To achieve genuine innovation, all three components – desirability, feasibility, and viability – must be addressed simultaneously.
Merely focusing on aspects like ideation, inspiration, or implementation falls short of capturing the essence of genuine innovation. The intersection of desirability, feasibility, and viability forms the core of genuine innovation, driving meaningful change and success in the market.
Differentiating True Innovation
You need to understand the critical components that make up true innovation to differentiate it effectively.
Misconceptions must be clarified to grasp the essence of genuine innovation.
Cross-functional collaboration isn't just beneficial but necessary for achieving true innovation outcomes.
Innovation Components Analysis
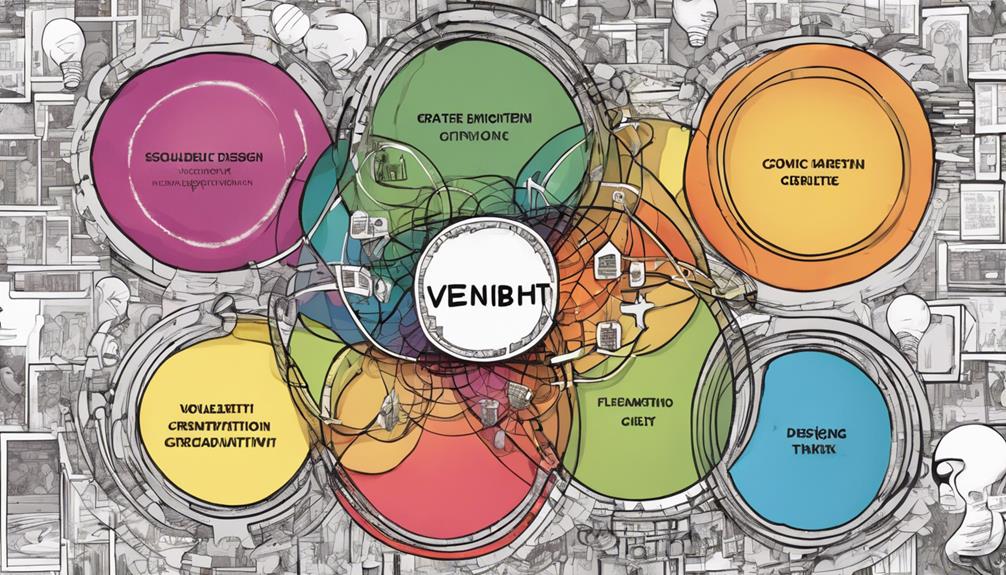
Exploring the components that distinguish true innovation involves analyzing the intersection of desirability, feasibility, and viability within a Venn diagram framework. True innovation goes beyond mere ideation or implementation; it necessitates a thorough evaluation of these three essential elements.
To differentiate true innovation effectively, consider the following:
- Desirability: Innovation must cater to a genuine need or desire in the market, ensuring that it addresses a specific problem or enhances user experience.
- Feasibility: It's essential to assess whether the innovation can be realistically implemented with the available resources, technology, and expertise.
- Viability: True innovation not only needs to be desirable and feasible but also sustainable in the long run, ensuring that it aligns with the organization's goals and generates value.
Understanding and balancing these components are vital in achieving genuine success in the innovation process.
Misconceptions Clarified
To differentiate true innovation from superficial approaches, understanding the core components of desirability, feasibility, and viability is essential.
True innovation goes beyond mere inspiration or ideation; it requires a deep integration of these elements.
The Venn diagram serves as a visual representation of how these factors intersect to guide authentic innovation efforts.
Misconceptions often arise when the term 'innovation' is misused, failing to grasp its multifaceted nature.
Without recognizing the need for cross-functional collaboration, innovation can become stagnant and fail to meet customer demands, technical capabilities, or economic sustainability.
Cross-Functional Necessity
Understanding the interconnectedness of desirability, feasibility, and viability is essential in distinguishing authentic innovation through cross-functional collaboration. True innovation thrives at the convergence of these three elements, ensuring that solutions not only meet customer needs but are also technically feasible and financially sustainable.
To emphasize the significance of cross-functional necessity in innovation, consider the following:
- Customer-Centric Solutions: Cross-functional teams bring diverse perspectives to the table, ensuring that the final product or service isn't just technologically feasible but also resonates with the target audience.
- Holistic Problem Solving: By incorporating input from various disciplines, innovation efforts can tackle challenges from multiple angles, leading to more inclusive and effective solutions.
- Sustainable Business Impact: The alignment of desirability, feasibility, and viability guarantees that innovations aren't just short-lived trends but have the potential to create long-term value for both customers and the business.
Misconceptions About Innovation

Misconceptions about innovation often stem from a narrow focus on ideation, inspiration, or implementation as standalone elements of true innovation. In reality, genuine innovation necessitates a holistic approach that considers desirability, feasibility, and viability.
Failure to embrace cross-functional thinking in innovation endeavors can result in superficial outcomes that lack the necessary depth and sustainability. Additionally, misusing the term 'innovation' without understanding its fundamental components can devalue its importance in the business sphere.
To drive substantial change and develop impactful solutions, it's imperative to grasp the core elements of true innovation. By recognizing the interconnectedness of ideation, inspiration, and implementation within the broader context of desirability, feasibility, and viability, organizations can enhance their innovation efforts and foster a culture that thrives on creative problem-solving.
Practical Application of the Venn Diagram
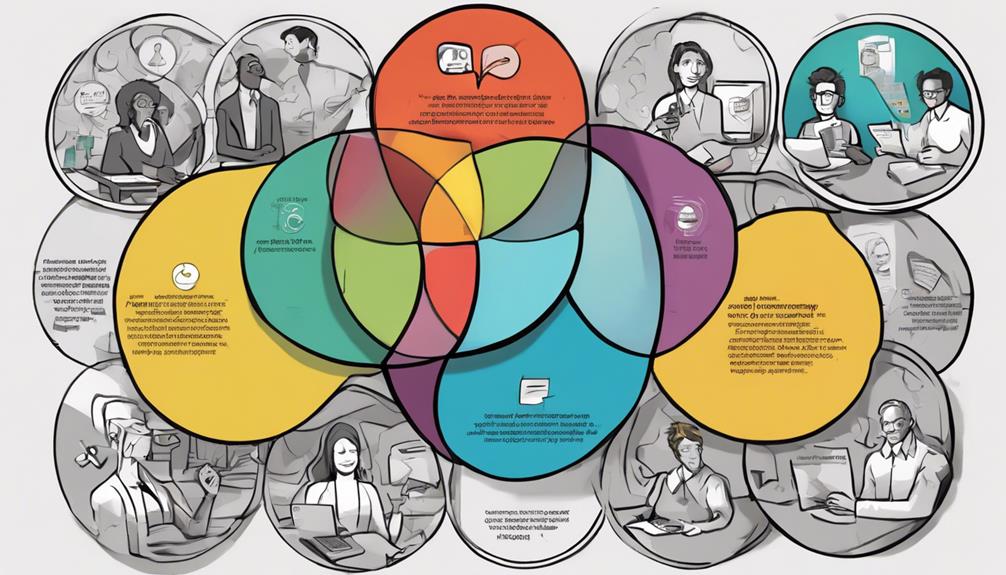
How can the Venn diagram be effectively utilized in the design thinking process to enhance data organization and pattern identification?
The Venn diagram proves to be a valuable tool during the empathize phase, aiding in the connection of data to the central design challenge.
Here are some practical applications of the Venn diagram in design thinking:
- Connect Data Sources: The diagram helps in comparing and contrasting ideas from various sources, enabling a thorough analysis of different perspectives.
- Identify Key Ideas: By focusing on shared themes among individuals, the Venn diagram assists in pinpointing essential concepts that can streamline the defining phase.
- Establish Efficiency: Starting with the key ideas identified within the Venn diagram structure, the process of defining issues and establishing connections towards a solution is made more effective and efficient.
Frequently Asked Questions
How Do You Explain a Venn Diagram?
When explaining a Venn diagram, you showcase relationships between different data sets by overlapping circles. It helps compare and contrast ideas through highlighting similarities and differences in the circles and their intersections.
What Is the Main Idea of the Venn Diagram?
The main idea of a Venn diagram is to visually compare and contrast different ideas or concepts. It involves overlapping circles showing unique and shared aspects. By organizing data and identifying patterns, it aids in issue definition during design thinking.
What Is the Venn Diagram in Set Theory?
Imagine a puzzle where circles overlap, revealing shared secrets. The Venn diagram in set theory masterfully illustrates relationships between groups, showcasing overlaps and differences. It's your guide to understanding interconnectedness and distinctions.
What Is Venn Diagram in Critical Thinking?
In critical thinking, a Venn diagram visually illustrates relationships between different concepts or data sets. It helps analyze similarities and differences to enhance logical reasoning and problem-solving skills. This tool is essential for organizing information effectively.
Conclusion
So, when you think of the design thinking Venn diagram, remember that it's like a recipe for innovation.
Just like how a chef combines different ingredients to create a delicious dish, you can combine empathy, creativity, and rationality to cook up some truly groundbreaking ideas.
Don't be afraid to mix things up and experiment – that's where the magic happens!
