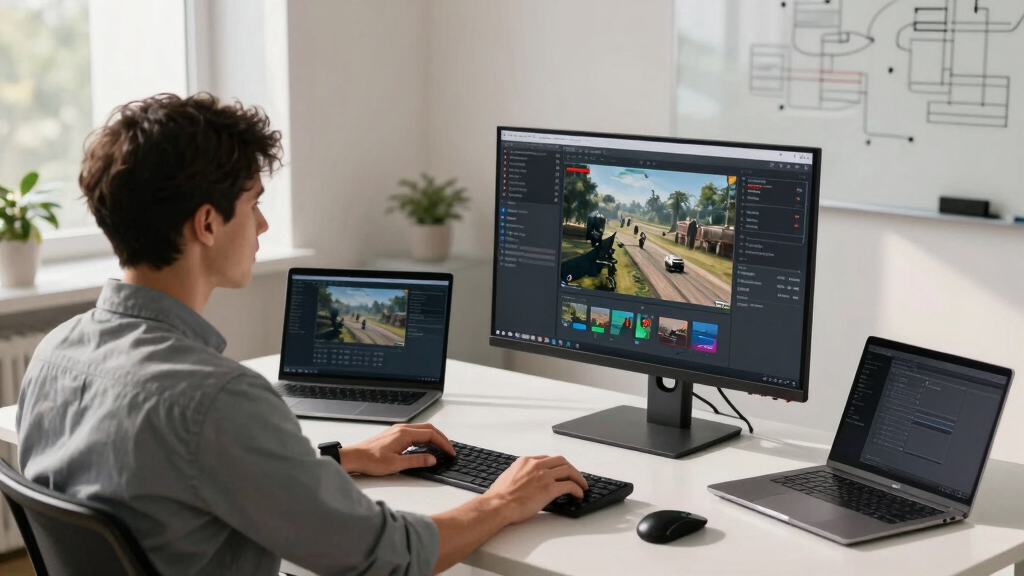

📊 Full opportunity report: Live Warzone Visualizations Powered By Artificial Intelligence on ThorstenMeyerAI.com — validation score, market gap, and execution plan.
TL;DR
A new web-based visualization transforms real-time Bitcoin trades into a cinematic battlefield using AI and browser tech. It offers an immersive, artistic view of market activity, not trading advice. The project is accessible for free in modern browsers.
A new web-based visualization uses artificial intelligence and browser technology to present live Bitcoin trades as a cinematic battlefield. This project, accessible at war.isbitcoindead.com, offers an immersive, real-time visual and auditory experience, illustrating the ongoing tug-of-war between buyers and sellers without providing trading advice.
The visualization connects directly to the public Binance trade stream via WebSocket, with a fallback to Coinbase, ensuring continuous real-time data flow. Each trade is depicted as a combatant—buy orders push the front line from the left, while sell orders advance from the right. Large liquidations are visualized as airstrikes, creating a visceral war scene. The entire system runs client-side, utilizing Canvas 2D graphics, WebAudio synthesis, and stream processing, with a minimal footprint of approximately 180KB.
The project features an automatic camera that shifts perspectives, a live DEFCON meter indicating market volatility, and a scrolling war log narrating ongoing activity. A synthetic soundtrack generated within the browser enhances the experience. A comprehensive scoreboard tracks seconds won, casualties, and dollar gains, creating a dynamic visual narrative of market activity. Importantly, Thorsten Meyer emphasizes that the project is not a trading tool; it does not involve wallets, signals, or advice, but aims to artistically represent market chaos.
Implications of Artistic Market Visualizations
This project demonstrates how advanced web technologies can be harnessed for creative data visualization, transforming raw market data into an immersive, cinematic experience. It offers a new way for enthusiasts and the public to visualize market dynamics without financial advice, potentially influencing how market activity is perceived and understood. It also showcases the potential for browser-based, client-side applications to deliver complex, real-time visualizations without backend infrastructure.
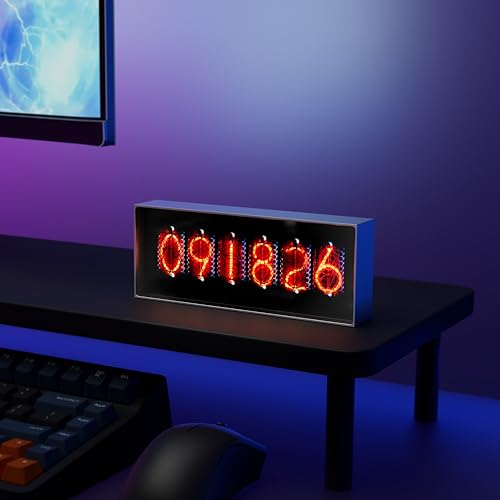
Electronic Display for Real-Time Cryptocurrency/Bitcoin/Stock Market Data, Time, Weather & Temperature, 164*28*65mm, Supports Image Upload and 30s Video Playback, App-Controlled, 960*360 Resolution
- Real-Time Data Display: Crypto, stock, time, weather updates
- Custom Media Uploads: Upload images and 30s videos
- App-Controlled Management: Manage content via dedicated app
As an affiliate, we earn on qualifying purchases.
As an affiliate, we earn on qualifying purchases.
Development of Visual Market Representations
The concept of visualizing market activity as art or cinema has been explored in various forms, but this project by isbitcoindead.com is notable for its real-time, browser-based implementation. It builds on recent advances in web graphics and stream processing, leveraging open data streams from Binance and Coinbase. The project aligns with broader trends in digital art and data visualization, emphasizing accessibility and immediacy. It is part of a growing interest in using artistic tools to interpret complex financial data.
“This visualization transforms market activity into a visceral experience, making the chaos of trading visually accessible.”
— an anonymous researcher
Electronic Display for Real-Time Cryptocurrency/Bitcoin/Stock Market Data, Time, Weather & Temperature, 164*28*65mm, Supports Image Upload and 30s Video Playback, App-Controlled, 960*360 Resolution
- Real-Time Data Display: Crypto, stock, time, weather updates
- Custom Media Uploads: Upload images and 30s videos
- App-Controlled Management: Manage content via dedicated app
As an affiliate, we earn on qualifying purchases.
As an affiliate, we earn on qualifying purchases.
Unconfirmed Aspects of the Visualization’s Technical Scope
While the project is live and accessible, details about its underlying algorithms and full technical architecture remain limited. It is unclear how the system processes and interprets data in real-time beyond the basic visualization, and whether future updates will include additional features or data sources. The broader impact on market perception or behavior is also still untested and unmeasured.
web-based financial data visualization tools
As an affiliate, we earn on qualifying purchases.
As an affiliate, we earn on qualifying purchases.
Future Developments and Potential Expansions
Developers may enhance the visualization with more detailed analytics, expand to other markets, or integrate user interaction features. Monitoring the project’s adoption and public reception will be key to understanding its influence. Additionally, further technical disclosures could clarify how the system operates and whether similar approaches are being adopted elsewhere.

Cosmostarart Chaos and Poise Series by C. Morningstar – Premium Unframed Canvas Print Artwork Set of 3, Modern Abstract Art, 12"x16" Canvas Wall Decor for Living Room, Bedroom, Office
- Collection Theme: Chaos and Poise Series by C. Morningstar
- Artwork Titles: Serenity in the Storm, Crimson Resolve, Eclipse of Clarity
- Art Style: Abstract ink, brush, and splatter techniques
As an affiliate, we earn on qualifying purchases.
As an affiliate, we earn on qualifying purchases.
Key Questions
Is this visualization a trading tool?
No, the project is purely artistic and data-driven; it does not provide trading signals, advice, or involve wallets.
How does the visualization connect to live data?
It connects directly to the Binance trade stream via WebSocket, with a fallback to Coinbase, ensuring continuous real-time updates.
Can I customize or interact with the visualization?
Currently, the visualization is automated with camera shifts and visual effects; user interaction features are not specified.
Is the project available for free?
Yes, it is accessible for free in any modern browser at war.isbitcoindead.com.
What is the purpose of this visualization?
Its purpose is to artistically represent market activity, providing an immersive, visceral view of trading dynamics without offering financial advice.
Source: ThorstenMeyerAI.com